Vending Machine Market Size in USA: 2026 Industry Report & Data
The vending machine market size in USA reached $22.6 billion to $27.5 billion in operator revenue, representing over 36% of the global automated retail industry. Driven by smart telemetry, contactless payment systems, and micro-market adoption, the domestic industry expands at a Compound Annual Growth Rate (CAGR) of 4.5% to 5.1%.
Automated retail in the United States comprises over 4.6 million operational units across commercial, industrial, and institutional spaces. Modern operators transition rapidly from traditional cash-operated hardware to internet-connected smart vending machines that increase average daily transaction volumes.
Executive Summary & US Vending Market Overview
The US vending machine market functions as a critical component of non-store automated retail, generating over $22.6 billion in annual consumer expenditures. Cold beverages, snacks, and specialized retail merchandise drive the primary transactional volume across all fifty states.
High labor overhead in brick-and-mortar retail accelerates corporate placement of self-service hardware. Commercial facility managers deploy equipment sourced through platforms like VMFS USA to provide 24/7 food and beverage access without incurring additional staffing payroll.
Market stability remains strong because vending operations capture high-margin impulse sales in controlled captive environments. Operators maintain consistent cash flow by matching specialized machine inventories with specific location demographic profiles.
Vending Machine Market Size in USA: Product & Location Breakdown
The vending machine market size in USA varies significantly across specific product verticals and physical placement environments. Cold beverages remain the single highest revenue generator, while industrial facilities lead in overall machine placement density.
Revenue Share by Product Category
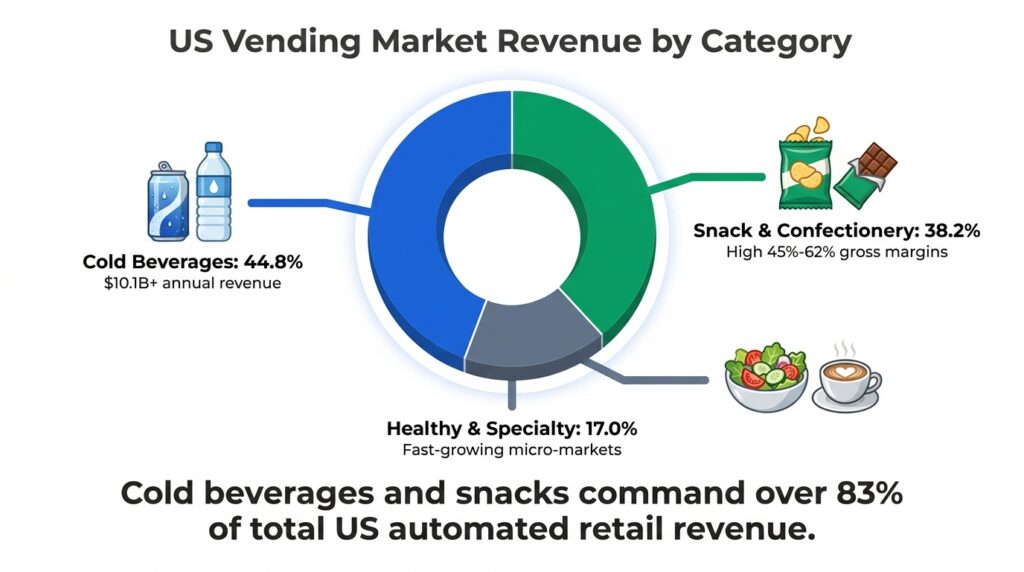
Cold beverages dominate US automated retail, accounting for 44.8% of overall market share ($10.1+ billion annually). Energy drinks, cold-brew coffees, functional waters, and traditional sodas deliver the highest unit turnover per machine deployment.
Snack vending represents the second-largest sector, commanding 38.2% of total industry revenue. Confectionery, salty snacks, and pastries provide high gross profit margins ranging between 45% and 62% per individual item sold.
Operators diversifying across multiple hardware configurations—including refrigerated units and ambient snack setups—maximize site yields. Detailed guides on choosing types of vending machines help business owners align machine capabilities with localized inventory demands.
Consumer preference shifts toward organic, low-sugar, and high-protein items have expanded the market share of premium healthy vending machines. Stocking high-margin health products allows operators to charge premium prices, increasing net profit per vend.
Navigating item selection requires analyzing foot traffic demographics and purchase velocity. Reviewing the most profitable vending machine products ensures operators maximize product margins while minimizing spoilage rates.
Revenue Share by Location Type
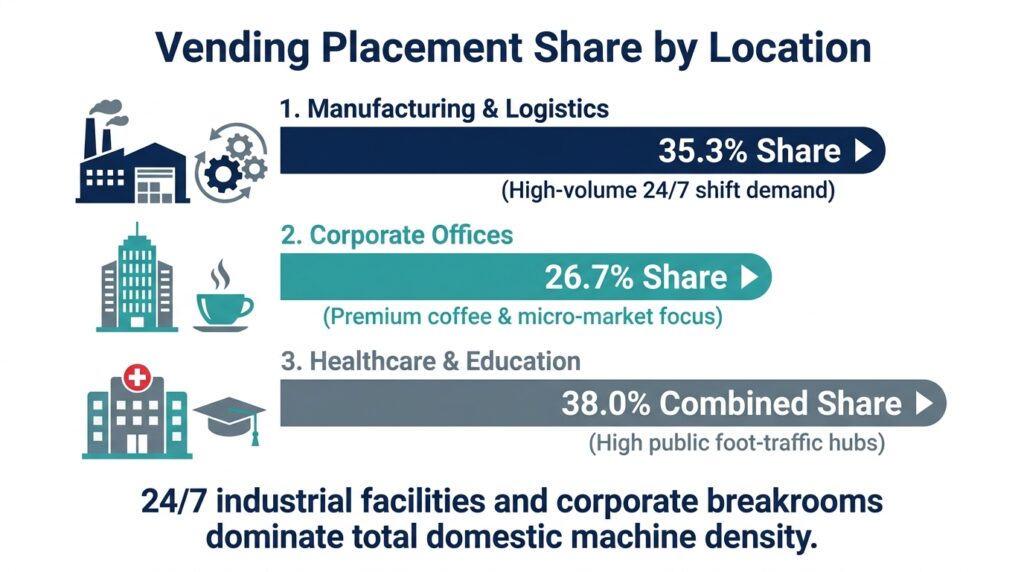
Manufacturing facilities and industrial fulfillment centers account for 35.3% of active US vending installations. Round-the-clock shift schedules create high, continuous demand for quick-consumption food and caffeine products.
Corporate office buildings hold 26.7% of location share, prioritizing premium hot coffee and fresh food options. Healthcare institutions, universities, and public transport hubs account for the remaining placement volume, benefiting from non-stop foot traffic.
Securing top-tier placement remains the primary operational variable driving overall route valuation. Comprehensive data on locating the best vending locations provides operators with criteria for negotiating high-footfall site access.
Selecting high-performing real estate requires calculating foot traffic metrics and shift counts. Learning how to choose a profitable vending location minimizes the risk of placing capital assets in low-turnover facilities.
Property managers and facility owners looking to monetize unused footprint can list your location and partner with operators to secure turnkey automated retail services without equipment management overhead.
Macro Growth Drivers & Consumer Trends
The growth of the US vending industry relies heavily on technological modernization and shifting payment preferences. Machine connectivity converts isolated hardware into intelligent retail nodes capable of dynamic inventory tracking.
Cashless Payments & Telemetry Integration
Cashless payment adoption accounts for 75.8% of all US vending machine transactions. Touchless credit card readers, Apple Pay, and Google Pay increase transaction speed while raising average basket size by 28% compared to cash-only units.
Cellular telemetry enables route managers to monitor inventory levels, track sales velocity, and identify mechanical outages remotely. Implementing streamlined inventory control cuts route driving costs by eliminating unnecessary restocking trips.
Integrated telemetry hardware provides exact sales metrics that streamline product reordering. Automated inventory data prevents stockouts of top-selling stock-keeping units (SKUs) during peak demand hours.
Expansion of Smart AI & Touchless Automated Retail
Smart AI vending machines equipped with computer vision and weight sensor shelves grow at a 12.5% CAGR. These units unlock upon card swipe, allowing consumers to inspect items before purchase, which elevates conversion rates.
Deploying high-tech hardware from the AI grab and go vending machines collection eliminates mechanical coil jams and expands the range of sellable product dimensions.
Higher price points on premium items inside smart machines drive significantly expanded profit margins. Analyzing AI vending machine profit margins reveals payback periods as short as 8 to 14 months on high-traffic placements.
Operator Economics: Profit Margins, Costs, & Revenue Splits
A standard US vending machine generates between $75 and $300 in weekly gross revenue, with top-tier placements exceeding $1,000 per week. Net operating margins across mature routes average 20% to 32% after accounting for inventory, location commissions, and hardware depreciation.
Average Machine Revenue and Expense Structure
Cost of Goods Sold (COGS) represents the largest recurring operational expenditure for vending businesses. Purchasing inventory in bulk keeps COGS at or below 45% of gross revenue, preserving route profitability.
Evaluating standard route performance using a reference guide on vending machine profit margin helps operators establish sustainable pricing formulas.
Commission structures paid to property owners typically range from 5% to 15% of net or gross sales depending on location volume. Understanding the standard vending machine revenue split operator vs location vs supplier prevents over-committing revenue during contract negotiations.
Capital Expenditure & Machine Acquisition Costs
Initial investment costs per machine depend on technological configuration, refrigeration capabilities, and payment hardware integration. Refurbished traditional units begin around $2,000, while new high-capacity multi-zone machines range from $4,500 to $9,000.
Reviewing a complete buyer’s handbook on buying a vending machine ensures operators select reliable components with accessible manufacturer replacement parts.
Multi-product placements often utilize versatile hardware from the combo vending machines collection to serve ambient snacks and cold beverages from a single electrical footprint.
Legal Framework, Entity Formation, & Contract Standards
Operating a commercial vending route requires compliant legal structures, regulatory filings, and standardized site agreements. Isolating personal assets from commercial liabilities protects business owners against third-party claims.
Business Structure & Tax Planning
Establishing a formal legal entity prevents personal asset exposure resulting from equipment property damage or product liability issues. Most independent operators opt for limited liability protection to simplify pass-through tax treatment.
Entrepreneurs starting operations can form an LLC for a vending machine business to establish corporate banking, secure merchant accounts, and obtain federal EIN numbers.
Proper tax structure setup ensures compliance with state sales tax reporting for automated retail transactions. Local health department permits are required when vending perishable food products or fresh dairy.
Site Contracts & Insurance Protection
Placement agreements must state exclusivity rights, contract duration, service access schedules, electrical power obligations, and commission rates. Clear terms prevent sudden machine removals when property ownership changes.
Utilizing a legally vetted vending machine contract template safeguards route investments and sets clear operational expectations with facility managers.
Comprehensive commercial insurance covers general liability, machine vandalism, and inventory loss. Consulting a practical vending machine insurance guide ensures operators carry adequate coverage limits without overpaying for premiums.
Scheduled preventative maintenance protects asset longevity and minimizes unexpected machine downtime. Tracking routine service via a guide on vending machine maintenance costs keeps operational overhead predictable.
Comparative Analysis: Traditional vs. Smart AI Vending
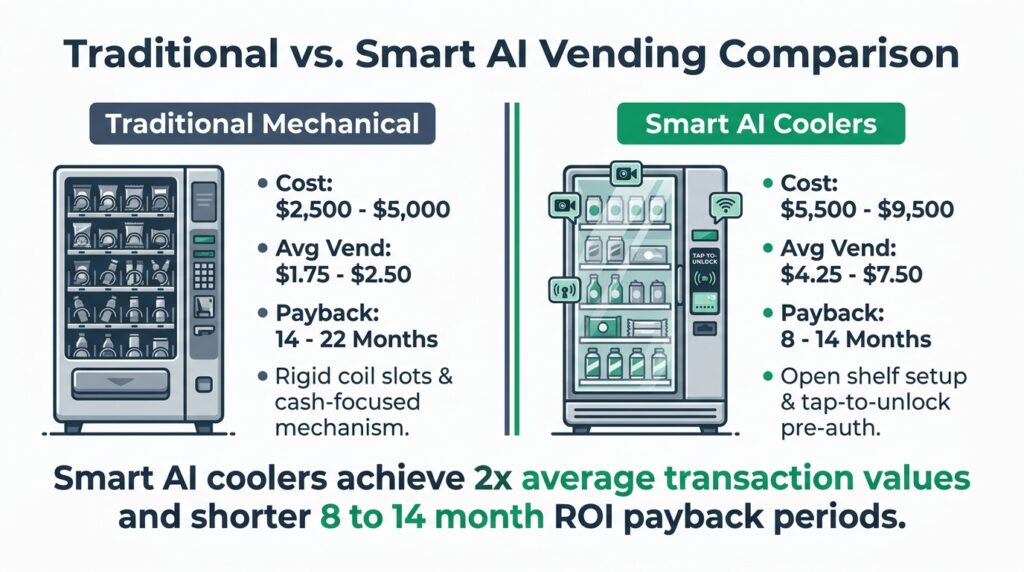
Choosing between traditional mechanical vending hardware and modern AI smart coolers dictates long-term capital intensity and operational efficiency. The following comparison highlights structural differences across key performance metrics.
| Performance Metric | Traditional Mechanical Vending | Smart AI Grab-and-Go Coolers |
| Average Hardware Cost | $2,500 – $5,000 | $5,500 – $9,500 |
| Payment Mechanism | Bill Acceptor, Coin Mechanism, Basic Card Reader | Contactless Credit Card / Mobile Wallet Pre-Auth |
| Product Restocking Constraints | Rigid coils; limited package dimensions | Open shelf configuration; flexible product sizes |
| Mechanical Failure Rate | Higher (Coil jams, coin mechanism jams) | Extremely Low (No moving drop motors or coils) |
| Average Transaction Value | $1.75 – $2.50 | $4.25 – $7.50 |
| Shrinkage & Theft Risk | Extremely Low (Locked glass cabinet) | Low-Medium (Mitigated via camera & pre-auth) |
| Remote Telemetry Capability | Basic DEX telemetry updates | Real-time sensor & vision tracking data |
| Average ROI Payback Period | 14 – 22 Months | 8 – 14 Months |
Traditional units excel in high-risk public spaces where physical security is paramount. Smart AI machines deliver superior financial performance in controlled corporate or residential settings where consumers purchase multiple items per transaction.
Route Scaling Strategy & Business Valuation
Scaling an automated retail operation from a single machine into a enterprise route requires data-driven reinvestment strategies. Optimization depends on pruning underperforming locations and reallocating capital into high-density placement areas.
Analyzing route performance metrics with strategies for how to use real numbers to scale smarter helps operators determine when to add locations.
Building automated service routines allows route owners to create semi-passive income streams. Applying methods for how to build real passive income with vending machines maximizes net earnings while minimizing direct labor hours.
Vending routes are valued as financial assets based on EBITDA multiples or percentage of annual gross revenues. Studying a complete overview on planning your vending machine business exit strategy enables operators to structure their financials for maximum payout upon sale.
Frequently Asked Questions
What is the current vending machine market size in the USA?
The US vending machine market size generates between $22.6 billion and $27.5 billion in annual operator revenue. It accounts for over 36% of global automated retail volume across more than 4.6 million installed units.
What is the average profit margin for a vending machine business?
The average net profit margin for a vending business ranges between 20% and 32% of gross revenues. Net margins depend on keeping Cost of Goods Sold (COGS) below 45% and securing location commission rates under 15%.
What products generate the highest revenue in US vending machines?
Cold beverages generate the highest total market revenue, capturing 44.8% of industry sales ($10.1+ billion). Snacks and confectionery hold the second-largest share at 38.2%, followed by fresh healthy foods and specialty goods.
How much does it cost to buy a commercial vending machine?
A commercial vending machine costs between $2,000 for a quality refurbished traditional unit and $9,000 for advanced smart AI grab-and-go hardware. Initial costs vary based on machine capacity, refrigeration units, and card reader integration.
What are the best locations for vending machines in the US?
Manufacturing plants, distribution warehouses, corporate office buildings, and healthcare facilities are top-performing locations. High-traffic environments with shift workers generate the highest transaction volume per machine.
What percentage of vending machine sales are cashless?
Cashless transactions account for 75.8% of total US vending revenues. Touchless credit card readers, mobile wallets, and NFC payment options drive significantly higher average transaction values than cash-only units.
How much money does one vending machine make per month?
An average vending machine yields between $300 and $1,200 in gross monthly revenue depending on location foot traffic. High-volume placements in airports or manufacturing facilities can exceed $3,000 per month.
Do I need an LLC to start a vending machine business?
Forming an LLC is recommended to protect personal assets from commercial liabilities, equipment claims, or property damage. An LLC also allows operators to open business bank accounts, obtain EIN numbers, and structure corporate taxes efficiently.
What is the projected growth rate for the US vending market?
The US vending machine market is projected to expand at a Compound Annual Growth Rate (CAGR) of 4.5% to 5.1% through 2034. Growth is driven by smart AI technology, cashless telemetry adoption, and automated retail demand.
How much commission do property owners expect from vending operators?
Property owners typically expect a location commission of 5% to 15% of gross machine sales. High-traffic placements may demand up to 20%, while smaller breakrooms often require zero commission in exchange for providing employee amenities.